Inventory Management Best Practices: 16 Actionable Tips
Inventory headaches show up in two ways: empty shelves when demand surges and crowded aisles full of cash you can’t access. Stockouts erode trust and revenue; overstock drains margin with carrying costs, obsolescence, and markdowns. Add inconsistent receiving, wandering pick paths, unreliable suppliers, spreadsheet drift, and returns piling up at the dock—and suddenly “we’ll fix it next quarter” turns into lost sales, rushed POs, and write‑offs.
This guide gives you 16 actionable best practices you can put to work right away. Each tip explains what it is, how to implement it step by step, and the metrics and tools to track impact—from ABC analysis, FIFO/FEFO rotation, data‑driven reorder points, EOQ, and rolling S&OP, to perpetual inventory integrated with POS/e‑commerce, barcode/QR/RFID traceability, disciplined cycle counting, warehouse slotting and pick paths, supplier scorecards, automated replenishment and exceptions, deadstock reduction, streamlined RMAs, and a focused KPI cadence. You’ll also see when offsite, climate‑controlled, keyless overflow storage can protect goods and free space without adding operational friction. Skim the list, pick the 3–5 moves with the fastest ROI for your operation, and start measuring results this month.
1. Use climate-controlled, keyless offsite storage for overflow (Keyless Storage)
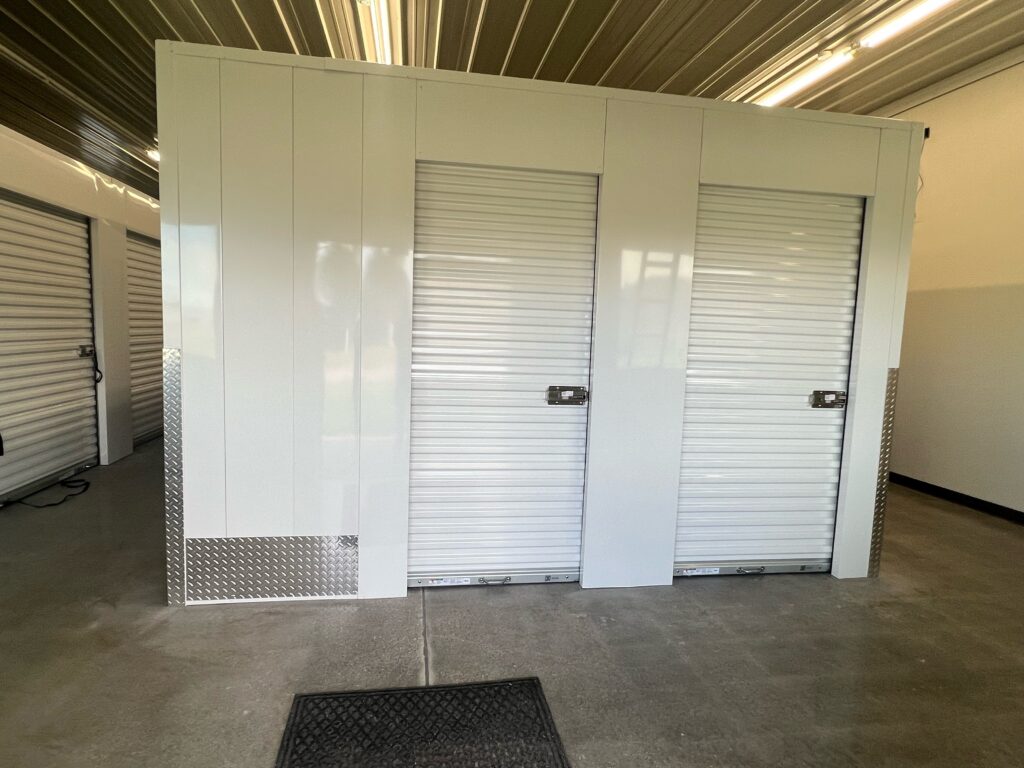
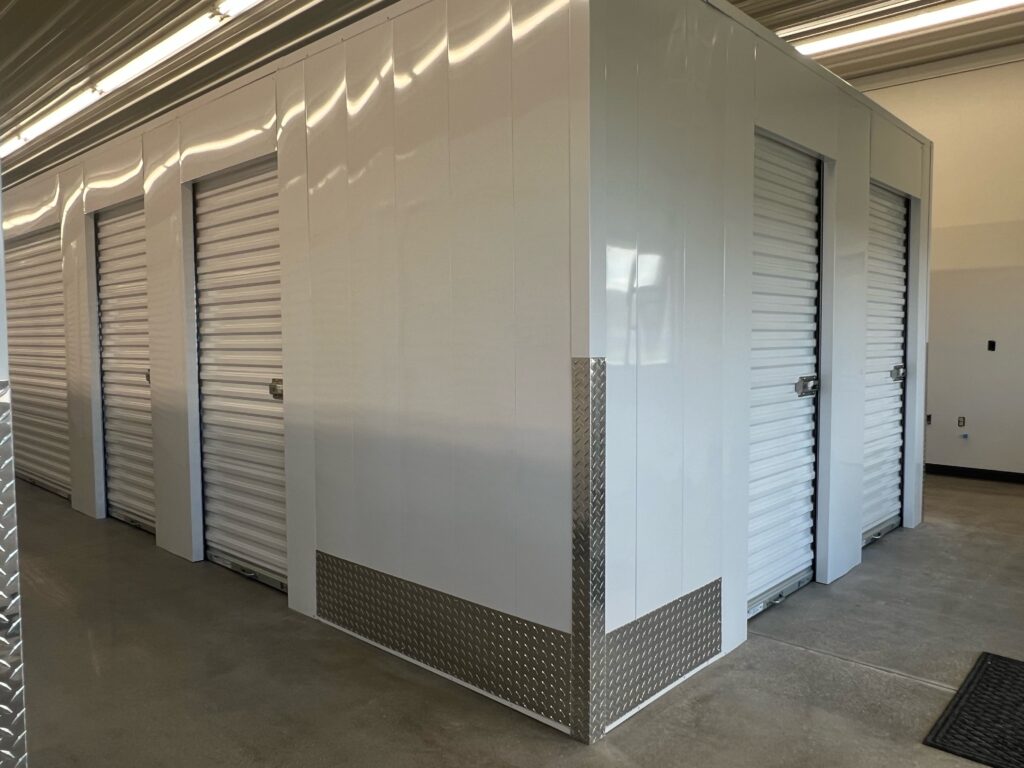
When your primary warehouse is jammed, pick accuracy drops and travel time spikes. A climate-controlled, keyless offsite “satellite stockroom” frees prime picking space, protects sensitive goods, and preserves cash tied up in damage and shrink. With smartphone-enabled access and 24/7 availability, you keep operations moving without juggling keys or business-hour gatekeepers—exactly the kind of inventory management best practice that smooths peaks and seasonality.
What it is
Treat offsite storage as a designated overflow location for low-velocity, seasonal, bulky, or safety-stock SKUs—especially items that benefit from temperature and humidity control. Keyless access via mobile app removes key control friction, while ground-floor, always-on access shortens retrieval windows and simplifies quick turns. In Sioux City, Keyless Storage offers 100% climate-controlled, ground-floor units with smartphone entry, 24/7 video security, online rental, and multiple sizes so you can right-size capacity.
How to implement it
Start by defining what belongs offsite and how it flows. Then operationalize it with clean location control, clear SLAs, and simple tech.
- Choose candidates: Prioritize C‑items, seasonal goods, bulky packaging, MRO, and safety stock; keep A‑items and fast movers in the main pick face.
- Set retrieval SLAs: Define target transfer lead time (e.g., “request-to-dock” window) and who can authorize pulls.
- Right-size capacity: Select unit sizes (e.g., 5×5, 10×10, 10×15, 10×20) and use online rental and waiting lists to scale as demand shifts.
- Establish location codes: Create offsite bin/location IDs (e.g.,
OS-KLS-10x20-Bay03) and label pallets/LPNs accordingly. - Integrate systems: Add the offsite location to your perpetual inventory/WMS or, at minimum, a controlled spreadsheet with barcode/QR labels.
- Control access: Ensure authorized staff have the smartphone app set up before go-live; document a simple check-in/out process.
- Standardize transfers: Use a “transfer order” template, verify counts on both ends, and schedule consolidation runs during off-peak hours.
- Cycle count offsite: Include the offsite location in your cycle counting cadence to maintain accuracy.
Metrics and tools
Track the impact on space, service, and shrink. Use simple formulas and dashboards to keep it honest.
- Primary space utilization:
Used cubic feet / Total cubic feet(target a sustained reduction after overflow moves). - Pick efficiency uplift: Change in average pick time or lines/hour in the main facility post-relief.
- On-time retrieval rate:
On-time offsite transfers / Total offsite transfers. - Stockout rate of A/B items: Should decline as prime space is freed for fast movers.
- Damage/shrink rate: Compare before/after for climate-sensitive SKUs.
- Carrying cost per cubic foot:
Monthly storage cost / Cubic feet usedto evaluate ROI.
Tools: perpetual inventory or integrated POS/e‑commerce, barcode/QR labeling, simple transfer orders, and a cycle counting schedule. For Sioux City operations, Keyless Storage’s climate control, 24/7 smartphone entry, ground-floor access, and online account management make the offsite workflow fast and predictable. https://www.youtube.com/embed/gc7_5SgE5ug
2. Segment inventory with ABC analysis and targeted service levels
Treating every SKU the same is expensive. ABC analysis focuses attention and cash on the products that drive most value, then dials back effort on tail items. It’s one of the inventory management best practices that turns the 80/20 rule into daily decisions—protecting availability on critical items while trimming carrying costs on low-impact stock.
What it is
ABC analysis classifies items by their economic impact, not just unit velocity. In practice, “A” items are the few SKUs that represent the majority of dollar usage and need tight control; “B” items sit in the middle; “C” items are many, low-value, quick-turn products. Pairing ABC with targeted service levels lets you set higher availability goals, faster reviews, and tighter supplier controls for A-class items, while using leaner policies on C-class stock.
How to implement it
Start with data you already have and convert it into simple, enforceable policies by class.
- Build the view: Export 6–12 months of sales and inventory data. Calculate
Annual Dollar Usage = Units sold × Unit cost(or revenue if margin data is limited). - Rank and classify: Sort SKUs by dollar usage and assign A/B/C cutoffs that fit your business (e.g., A covers the highest share of dollar usage, B the next slice, C the remainder).
- Set policies by class: Define target service levels, review cadence (e.g., daily for A, weekly for B, monthly for C), safety stock posture, and cycle count frequency (A most often).
- Align operations: Slot A-items to prime pick locations; align supplier terms and backup sources for A/B; allow larger order intervals or vendor-managed options on C where appropriate.
- Update master data: Bake class-driven min/max, reorder points, and lead times into your system so replenishment follows the rules automatically.
- Revisit quarterly: Re-run ABC to catch seasonality and new winners; promote/demote SKUs as their contribution shifts.
Metrics and tools
Measure if attention is flowing to where it pays off.
- Inventory turnover ratio by class: Faster turns on A and B signal healthy capital use.
- Stockout rate/fill rate by class: Higher service for A relative to C validates policy design.
- Days of inventory on hand (DIO) by class: Helps right-size buffers and space.
- Cycle count accuracy by class: Confirms that A-items stay highly accurate.
- Supplier on-time performance for A/B SKUs: Ensures critical items meet lead-time assumptions.
Tools: a perpetual inventory or inventory management system with ABC fields, POS/e‑commerce data feeds, and barcode labels. Spreadsheets can start the process; as you scale, automate classification, min/max updates, and class-based cycle counting in your software.
3. Standardize receiving, inspection, and put-away procedures
Most inventory errors start at the dock. Inconsistent receiving creates mismatches between physical stock and system counts, which ripple into stockouts, mispicks, and write-offs. Standardizing how every shipment is checked, counted, labeled, and stored turns a chaotic “first mile” into a repeatable, auditable workflow—one of the highest‑ROI inventory management best practices you can implement.
What it is
A documented, trained, and enforced set of SOPs that governs the flow from truck arrival to stocked location. It specifies who does what, in what order, and with what tools—covering verification against POs, physical counts, barcode capture, quality inspection, exception handling, and directed put‑away. As Business News Daily notes, receiving done the same way every time reduces discrepancies and keeps numbers aligned with purchase orders.
How to implement it
Write the playbook, then enable it with labels, scanners, and training so the process sticks.
- Define the flow: Dock check-in → stage → verify against PO → count (prefer blind counts for accuracy) → inspect → label → directed put‑away → close receipt.
- Create checklists: Standard forms for carton/pallet counts, damage checks, lot/serial capture, and over/short/damaged (OS&D) escalation.
- Use barcodes/QRs: Print LPN/pallet labels at receipt; scan into a perpetual system to eliminate manual data errors.
- Capture traceability: Record lot/serial, expiry, and country of origin where applicable.
- Set put‑away rules: Direct items to assigned zones/slots; avoid ad‑hoc storage that breaks slotting logic.
- Train and certify: Teach every receiver the same steps; spot-audit adherence weekly.
- Handle exceptions fast: Triage discrepancies to a quarantine/MRB area; do not commingle until resolved.
- Schedule cycle touches: Count newly stocked A‑items within 24–48 hours to confirm accuracy.
Metrics and tools
Measure speed, accuracy, and control. Post the targets at the dock and review them daily.
- Dock‑to‑stock time:
Receipt close time − trailer arrival(target hours, not days). - Receiving accuracy (%):
Correct lines received / Total lines × 100. - Discrepancy rate:
OS&D lines / Total lines × 100. - Put‑away SLA hit rate:
Put‑away within X hours / Total receipts. - Damage rate at receipt:
Damaged units / Units received × 100. - Cycle count accuracy (post‑receipt): Confirms process quality.
Tools: SOPs and checklists, barcode/QR labels and mobile scanners, a perpetual inventory/WMS or integrated POS/e‑commerce, clearly marked staging/quarantine zones, and brief refresher training to keep the standard tight.
4. Adopt FIFO/FEFO rotation to prevent spoilage and obsolescence
Aging inventory is silent margin erosion. Moving the oldest units first reduces waste and write‑offs, while keeping availability honest. As Business News Daily notes, FIFO helps sell older stock before newer arrivals to reduce waste; for dated goods, FEFO tightens that by prioritizing soonest-to-expire units. Together, they’re foundational inventory management best practices.
What it is
FIFO (first-in, first-out) allocates and picks the earliest-received inventory first. FEFO (first-expire, first-out) allocates by the closest expiration date, which is essential for perishables, regulated items, and anything with shelf life. Use FIFO for undated goods; use FEFO whenever lots carry expiries.
How to implement it
Stand up rotation rules in your process and system, then make the shelf match the rule.
- Identify date-controlled SKUs: Flag items requiring lot/expiry tracking and define shelf-life targets by SKU.
- Capture dates at receipt: Scan lot/serial and
ExpirationDate; quarantine short-dated or damaged stock. - Configure pick allocation: In your WMS/IMS, set allocation to FIFO or FEFO by SKU; block manual overrides.
- Slot for rotation: Place oldest/earliest-expiry forward; use clear “Oldest Here” lane markers and date labels.
- Label visibly: Apply lot/expiry labels on cases and pallets; use color bands for <30, <60, <90 days.
- Automate alerts: Trigger tasks when stock hits “short-dated” thresholds (e.g., 60/30/14 days).
- Audit and coach: Spot-check picks for rule compliance weekly; retrain when exceptions appear.
Metrics and tools
Measure compliance and waste so you can course-correct fast.
- Rotation compliance (%):
Picks following rule / Total picks × 100. - Expiry waste rate:
Expired units / Units received × 100. - Inventory age (days): Average days on hand by SKU/lot.
- Days-to-expiry at pick:
ExpirationDate − PickDate(higher is better). - Obsolescence write-offs ($): Track trend month over month.
Tools: perpetual inventory/WMS with lot/expiry fields, barcode/QR scanning for lot capture, shelf-life alerts, directed picking, and visual lane/date labels. RFID can help on high-value items, but barcodes and disciplined process deliver most of the benefit.
5. Set data-driven reorder points and safety stock
Guesswork creates stockouts and bloated shelves. Reorder points (ROP) and safety stock calculated from your actual demand and supplier lead times trigger replenishment at the right moment—protecting availability without padding inventory. This is a cornerstone inventory management best practice and dovetails with ABC classes: higher service targets for A-items, leaner buffers for C-items.
What it is
A reorder point is the on-hand level that triggers a purchase or production order. It combines the demand you expect during lead time plus a buffer for variability. Use simple, proven formulas so the math is transparent and repeatable:
ROP = LTD + SSLTD (Lead Time Demand) = AvgDailyUsage × AvgLeadTimeDaysSS (Safety Stock) = (MaxDailyUsage × MaxLeadTimeDays) − (AvgDailyUsage × AvgLeadTimeDays)
How to implement it
Start with your history, then encode the rules in your system so they run every day—no spreadsheets at 11 p.m.
- Collect data: 6–12 months of daily sales/usage and actual supplier lead times per SKU.
- Compute baselines:
AvgDailyUsage,MaxDailyUsage,AvgLeadTimeDays,MaxLeadTimeDaysby SKU (or by ABC class if data is thin). - Calculate SS and ROP: Use the formulas above; set higher SS for A-items and critical components.
- Set min/max (optional): Derive
Min = ROP,Max = Min + EOQ(you’ll refine EOQ in section 7). - Load to system: Update master data in your perpetual inventory/IMS so replenishment and low‑stock alerts use the new ROPs.
- Pilot and tune: Test with a subset of A- and B-items; compare triggers to real consumption and adjust.
- Review cadence: Recompute quarterly (monthly for seasonals) and whenever supplier lead times shift.
Metrics and tools
Track if the new triggers reduce firefighting while trimming excess.
- Stockout rate / Fill rate by class: Should improve, especially for A-items.
- Expedite rate:
Expedited POs / Total POs—falling rates signal healthier buffers. - Service level vs. target: By SKU/class to validate buffer design.
- Average days of inventory (DIO): Should stabilize or decline without hurting fill.
- Supplier lead-time accuracy: Gap between promised and actual days.
Tools: a perpetual inventory/IMS integrated with POS/e‑commerce, automated low‑stock alerts, barcode-driven transaction accuracy, and a simple ROP calculator template. Pair with your ABC policy so service targets and safety stock stay aligned with item importance.
6. Forecast demand with a rolling S&OP cadence
If you only react to orders, inventory swings between famine and feast. A rolling S&OP (sales and operations planning) cadence turns scattered signals—POS data, e‑commerce trends, promotions, seasonality—into a single, cross‑functional plan that balances service and cash. The outcome is a consensus forecast and a feasible supply plan that feeds reorder points, safety stock, purchasing, and capacity.
What it is
S&OP is a structured, recurring process (typically monthly with weekly checkpoints) where sales, marketing, operations, and finance align on a 12–18‑month rolling horizon. You start with a statistical baseline forecast, enrich it with market intelligence (promos, launches, events), reconcile it against supply constraints and lead times, and commit to a plan. Smaller teams can run a tight 60‑minute monthly S&OP plus a brief weekly exceptions huddle.
How to implement it
Stand up a lightweight but disciplined drumbeat. Keep the calendar fixed, the inputs clean, and the decisions visible.
- Lock the cadence: Week 1 data close; Week 2 demand review; Week 3 supply review; Week 4 executive sign‑off. Roll forward every month.
- Build the baseline: Use simple models (moving average, exponential smoothing) by SKU/channel, segmented by ABC class and seasonality. Start weekly for fast movers.
- Layer business intelligence: Add promotions, price changes, marketing campaigns, new products, and known events; note items that sell together for attach effects.
- Test constraints and scenarios: Check supplier lead times/MOQs and your capacity. Create base/upside/downside scenarios and agree on triggers.
- Translate to supply: Convert the consensus forecast into purchase plans, production schedules, and updated
ROP/SStargets (see section 5). - Document assumptions and freezes: Capture the “why,” define a short frozen window, and version the plan for traceability.
- Close the loop: Each week, compare actuals vs. forecast, explain variance, and adjust the next cycle.
Metrics and tools
Measure forecast quality and the service/cost outcomes it drives. Keep the math simple and shared.
- MAPE:
MAPE = (1/n) × Σ |(A − F) / A| × 100% - WAPE:
WAPE = Σ|A − F| / ΣA × 100%(good for skewed mixes) - Bias (%):
(Σ(F − A) / ΣA) × 100%(positive = over‑forecast) - Service/Fulfillment: Fill rate, OTIF, stockout rate by class
- Inventory health: Turns, DIO, expedite rate, excess & obsolescence
- Promo lift accuracy: Planned vs. actual uplift
Tools: integrated POS/e‑commerce feeds, a perpetual inventory/IMS with forecasting and low‑stock alerts, barcode‑driven transaction accuracy, and a shared S&OP calendar/dashboard. Spreadsheets can start it; as volume grows, move to inventory management software with built‑in forecasting and reporting so reviews are fast, visual, and repeatable.
7. Calculate EOQ and optimize order cadence and MOQs
Ordering too often raises admin and freight costs; ordering too much inflates carrying costs and risk. Economic Order Quantity (EOQ) gives you the cost‑minimizing lot size, then you layer in real‑world constraints like supplier minimum order quantities (MOQs), case packs, and price breaks to set a practical order cadence. Tie EOQ to your reorder points so replenishment is precise, not padded.
What it is
EOQ balances ordering cost (per PO) against annual holding cost (per unit) to find the optimal quantity: EOQ = sqrt( (2 × D × S) / H ), where D is annual demand (units), S is cost per order, and H is annual holding cost per unit. In a min/max policy, use EOQ as your order-up-to band: Min = ROP, Max = ROP + EOQ. This is the “fixed order quantity” approach many teams use once ABC classes, reorder points, and lead times are set.
How to implement it
Start with good estimates, then reconcile the math with supplier and space realities.
- Quantify inputs: Estimate
D(12 months),S(admin, receiving, freight per order), andH(capital, storage, shrink, obsolescence per unit/year). - Calculate EOQ: Apply the formula; keep units and timeframes consistent.
- Check constraints: Compare EOQ to supplier MOQ, case‑pack multiples, pallet layers, and storage limits; round up to the nearest feasible multiple.
- Consider price breaks: If tiered pricing exists, model total cost at each break (ordering + holding) and choose the lowest.
- Set order interval:
Order interval (days) = EOQ / AvgDailyDemand; align with truck routes and dock capacity. - Align by ABC: Use EOQ as‑is for A/B; consider longer intervals for C to reduce touches.
- Update system: Load EOQ‑based max levels and enforce pack multiples; connect to
ROPso POs auto‑generate. - Review cadence: Recompute quarterly or when demand/lead times shift.
Metrics and tools
Gauge whether total cost drops without hurting service.
- Total cost check:
Ordering cost = (D / EOQ) × S;Holding cost = (EOQ / 2) × H; target a combined decline. - Turns and DIO: Higher turns/lower DIO indicate healthier cadence.
- Expedite rate: Fewer expedites after EOQ go‑live.
- PO efficiency: Lines per PO and freight utilization improve.
- Fill rate/stockouts: Service holds or improves as costs fall.
Tools: inventory/IMS with min‑max and pack multiple controls, supplier price/MOQ matrix, simple EOQ calculator template, and integrated POS/e‑commerce demand history to keep D current. Pair with your ROPs and ABC classes for a coherent policy.
8. Move to a perpetual inventory system integrated with POS and e-commerce
Manual spreadsheets and periodic counts can’t keep pace with multi‑channel demand. A perpetual inventory system updates on‑hand in real time with every receipt, sale, transfer, and return—and when it’s integrated with your POS and e‑commerce channels, you prevent overselling, cut data entry, and see one truth across locations. While many small firms start with periodic counts, continuous tracking plus routine cycle counts delivers higher accuracy and fewer stockouts.
What it is
A perpetual inventory system is a live ledger that adjusts inventory continuously. Integration with POS and online stores means each order immediately decrements available stock, receipts increment it, and returns/adjustments flow back without manual intervention. You still audit with cycle counts, but day‑to‑day availability is current—supporting automated replenishment, accurate ATP (available‑to‑promise), and faster financials.
How to implement it
Start with clean data and a clear go‑live plan, then let the system run the transactions.
- Standardize master data: Normalize SKUs, units of measure, bundles/kits, locations (including offsite), and barcodes across all channels.
- Select software with native connectors: Use an inventory/OMS/WMS that integrates to your POS and e‑commerce so sales, receipts, and returns sync both ways.
- Map flows and rules: Define how orders, preorders/backorders, transfers, and RMAs affect on‑hand and available‑to‑sell.
- Perform a baseline count: Do a cycle count of A/B items; import on‑hand as your opening balance.
- Plan cutover: Freeze adjustments briefly, run initial sync, and go live during an off‑peak window.
- Train for “transact or it didn’t happen”: Every receipt, move, and adjustment must be scanned/recorded at the moment it occurs.
- Keep auditing: Run daily exception reports and a cycle counting cadence to catch drift.
Metrics and tools
Track accuracy, latency, and service to validate the move.
- Inventory accuracy (%):
1 − |System − Physical| / Physical × 100(target 97–99%+ for A‑items). - Oversell rate:
Orders with negative available / Total orders(drive toward zero). - Order sync latency: Seconds from sale to updated on‑hand.
- Fill rate / Stockout rate: By SKU/class, across channels.
- Expedite and backorder rates: Should decline as availability becomes reliable.
- Dock‑to‑book time: Minutes from receipt to system‑posted inventory.
Tools: a perpetual inventory/IMS with POS and e‑commerce integrations, API/webhook connectors, mobile scanning, user permissions, audit/variance reports, and a documented cycle count program to keep the numbers tight.
9. Enable barcode/QR/RFID scanning with lot and serial traceability
Manual keying creates errors and delays you can’t afford. Scanning turns every movement—receipts, transfers, picks, RMAs—into fast, accurate transactions, while lot and serial capture gives end‑to‑end traceability for compliance, recalls, and FEFO rotation. Barcodes and QR codes are low-cost and smartphone-friendly; RFID adds speed and range for high‑value or fast‑moving items.
What it is
A data-capture layer that encodes identifiers (SKU, LPN, bin), plus traceability fields (Lot, Serial, ExpirationDate, CountryOfOrigin) into machine-readable labels or tags. Barcodes/QRs require line-of-sight scans; RFID can read many tags at once and from distance (passive tags ~40 ft; active tags up to ~300 ft per NetSuite). Both feed a perpetual inventory system to eliminate manual entry and keep stock accurate across locations.
How to implement it
Start simple with barcodes/QRs, then pilot RFID where it pays off. The goal is “no scan, no move.”
- Standardize data and symbology: Use GS1‑compatible Code 128/QR with fields for
SKU,LPN,Lot,Serial,ExpirationDate. - Design labels/tags: Print durable pallet/case and bin labels; color-band short‑dated lots for FEFO.
- Equip the floor: Deploy mobile scanners or camera‑equipped smartphones; add RFID readers/portals for high‑shrink or high‑velocity zones.
- Embed scans in SOPs: Scan at receiving, put‑away, moves, picks, pack/ship, cycle counts, and returns; block transactions without a scan.
- Map to system fields: Ensure your IMS/WMS stores lot/serial/expiry and enforces FEFO/FIFO allocation.
- Pilot RFID selectively: Start with pharmaceuticals, electronics, or high‑value SKUs; place readers at choke points (e.g., exits, dock doors).
- Train and audit: Short task-based training; weekly spot checks on scan compliance.
Metrics and tools
Prove the case with speed, accuracy, and traceability metrics.
- Scan compliance (%):
Scanned transactions / Total transactions × 100. - Receiving dock‑to‑book time: Minutes from arrival to posted stock.
- Inventory accuracy (%): Variance vs. physical by SKU/class.
- Mispick rate / Return due to wrong item: Should drop post‑scanning.
- Trace time (lot/serial): Minutes to trace affected inventory in a mock recall.
- RFID read reliability: Reads per pass and exception rate at portals.
Tools: IMS/WMS with barcode/lot/serial fields and FEFO allocation, mobile scanning apps, label printers, GS1 label templates, and (optional) RFID tags/readers with portal software. These inventory management best practices cut errors, speed transactions, and make recalls and audits routine instead of stressful.
10. Run a disciplined cycle counting program
Annual “all hands” inventories are disruptive and still leave you blind most of the year. A disciplined cycle counting program spreads verification across days and weeks so you continuously correct errors, strengthen your perpetual inventory, and prevent stockouts and write‑offs. It’s one of the most reliable inventory management best practices for keeping system truth aligned with the shelf.
What it is
Cycle counting is a scheduled, targeted method of physically verifying small subsets of inventory (by SKU, location, or class) on a recurring cadence. Instead of shutting down to count everything, you count a little every day, focusing more often on high‑value or high‑velocity items and areas with prior issues. Business News Daily and NetSuite both highlight routine auditing, spot checks, and class‑based counts as core controls.
How to implement it
Design the plan, lock the schedule, and make “no scan, no move” and “no move during count” the rules.
- Build a count calendar: Use ABC classes to set frequency (A most often, then B, then C); include recent-problem zones.
- Freeze movement: Count after hours or temporarily lock the bin/zone during counting to avoid in‑count transactions.
- Use blind counts: Don’t show expected quantities; have a second person recount variances over your tolerance.
- Scan everything: Capture
SKU,Bin,LPN, andLot/Serialwith mobile scanners to eliminate manual entry errors. - Set tolerances and workflows: Define variance thresholds, automatic recount triggers, and approval paths for adjustments.
- Record root causes: Tag variances (receiving error, mis-slot, unposted move, damage) and log corrective actions.
- Segregate duties: Different people count, recount, adjust, and investigate; rotate counters to prevent routine bias.
- Close the loop: Post adjustments promptly, update SOPs (e.g., receiving/put‑away), and feed learnings into training.
Metrics and tools
Measure accuracy, coverage, and causes so the program gets sharper every month.
- Inventory accuracy (%):
1 − |System − Physical| / Physical × 100 - Count coverage (%):
Completed counts / Planned counts × 100by class/area - Variance rate:
Lines with variance / Lines counted × 100and variance value ($) - Recount resolution rate:
Resolved on 2nd count / Total variances - Root-cause Pareto: Top variance reasons and their share
- Count productivity:
Lines counted per hourper counter - Shrink trend: Periodic write‑offs vs. prior periods
Tools: a perpetual inventory/IMS or WMS with cycle count tasks and tolerance rules, barcode/QR scanning, count cards/checklists, variance and exception reports, and simple dashboards for coverage and accuracy by class. Keep the cadence sacred—small, daily discipline beats big, annual heroics.
11. Optimize warehouse layout, slotting, and pick paths
Great inventory accuracy still bleeds margin if pickers walk miles a day. A tuned layout with data‑driven slotting and intentional pick paths cuts travel, lifts lines per hour, and lowers errors. This is one of those inventory management best practices that compounds gains from ABC analysis, FIFO/FEFO, and cycle counting.
What it is
Layout optimization arranges receiving, staging, forward pick, bulk reserve, packing, and shipping so product flows in one direction with minimal cross‑traffic. Slotting places SKUs by velocity, size/cube, and affinity (items that sell together) so the fastest movers live in the “golden zone” (easy reach) near pack/ship. Pick path design defines the sequence and method (single, batch, zone, wave) so routes are short, logical, and consistent.
How to implement it
Start with heat maps from your order history, then redesign for flow and proximity.
- Map flows: Draw current receiving→put‑away→pick→pack→ship; remove backtracking and create clear one‑way aisles.
- Create zones: Separate forward pick (high‑velocity) from reserve/bulk; add quarantine/MRB and cross‑dock lanes.
- Slot by data: Use ABC velocity, cube, and family ties to place SKUs; put A‑items closest to pack out and at waist‑to‑shoulder height.
- Engineer picks: Standardize paths (e.g., serpentine, end‑to‑end); choose pick method (single for low volume, batch/zone for higher volume).
- Right-size locations: Match bin sizes to SKU cube to prevent overflows; label every bay/bin with scannable IDs.
- Reduce touches: Pre‑stage common cartons, dunnage, and labels at pack stations; kit frequent bundles in advance when justified.
- Pilot, then roll: Test a zone, gather picker feedback, and expand; refresh slotting after seasonality or new winners emerge.
Metrics and tools
Track travel, speed, and accuracy to prove the redesign.
- Travel time per line:
Picker travel minutes / Lines picked(target down). - Lines per hour (LPH): By picker/method; should rise post‑slotting.
- First‑pass pick accuracy:
Correct picks / Total picks × 100. - Dock‑to‑ship cycle time: From receipt to shipment for fast movers.
- Space utilization:
Used slots / Total slotsand forward‑pick cube use. - Re-slotting cadence: % of A/B SKUs reviewed and moved each month.
Tools: perpetual inventory/WMS with location management, slotting reports, and directed pick paths; barcode/QR labels on aisles/bins; simple heat‑map exports from POS/e‑commerce to identify high‑velocity SKUs and common order affinities. Regular audits keep the layout honest and the pick paths fast.
12. Measure supplier performance and diversify your sources
Great inventory plans collapse if suppliers miss dates, short ship, or change terms without warning. Treat suppliers like any other process: define standards, measure them, and build redundancy. A clear scorecard plus deliberate supplier diversity (alternate vendors, routes, and ports) improves service, lowers risk, and reduces firefighting when demand or logistics shift.
What it is
Supplier performance management is a structured system of SLAs and scorecards—for OTIF delivery, lead times, quality, documentation accuracy, and responsiveness—reviewed on a set cadence with corrective actions. Diversification means qualifying backup sources and logistics paths so a single delay doesn’t trigger stockouts. As Business News Daily notes, analyzing supplier reliability and practicing supplier diversity strengthens resilience and protects availability.
How to implement it
Start with your critical SKUs, set expectations in writing, then keep at least one warm backup for the items that matter most.
- Map criticality: Link SKUs (especially A/B items) to current suppliers; flag single-source, single-port, or long‑lead risks.
- Define SLAs: Specify lead time, OTIF, fill rate, quality acceptance, ASN/label accuracy, MOQ flexibility, and expedite terms.
- Build scorecards: Automate capture from PO/receipt data; publish monthly results and require corrective action for misses.
- Run QBRs: Review forecasts, variances, root causes, and improvements; document actions and owners.
- Pre‑qualify alternates: Approve at least one backup per critical SKU; place a small recurring split (e.g., 70/30) to keep the source active.
- Diversify routes: Add alternative carriers, ports, and modes where feasible; plan contingencies for seasonal or geopolitical risk.
- Tune buffers: Increase safety stock temporarily during onboarding or instability; use offsite climate‑controlled storage if space is tight.
- Negotiate terms: Align MOQs/price breaks with EOQ; add penalties or cost‑share for chronic misses.
Metrics and tools
Track both reliability and risk so decisions are fact‑based, not anecdotal.
- OTIF (%):
On‑time & in‑full lines / Total lines × 100 - Lead‑time adherence:
|Actual − Promised|days andStdDev(LeadTimeDays) - Supplier fill rate:
Units received / Units ordered × 100 - Quality acceptance rate:
Accepted units / Received units × 100or DPPM - ASN/label accuracy (%): Correct documents/labels per receipt
- Expedite rate (supplier‑caused):
Expedited POs / Total POs - PPV (purchase price variance): vs. standard or last cost
- Risk score: Concentration (country/port), financial health, capacity, and compliance
Tools: inventory/IMS with vendor performance reports, simple scorecard dashboards, SRM or shared QBR templates, risk registers, and S&OP integration so suppliers see forecast signals early. Prioritize actions on A‑class items where a miss hurts most.
13. Automate replenishment, low-stock alerts, and exception workflows
Manual reordering and inbox triage create surprises: missed POs, rush freight, and stockouts. Automation turns your rules (reorder points, min/max, EOQ) into always-on triggers, while exception workflows surface what truly needs human attention—supplier misses, negative on-hand, short‑dated lots, and backorders. The payoff is fewer emergencies, lower carrying costs, and steadier service.
What it is
Automation uses your perpetual inventory and sales signals to watch stock levels in real time, generate POs or transfer orders at the right moment, and notify owners when thresholds are crossed. Modern inventory systems include procurement automation, low‑stock alerts, and POS/e‑commerce integration so reordering, tracking, and reporting happen without spreadsheets. Exceptions are routed as tasks with clear SLAs instead of buried in emails.
How to implement it
Start with clean master data and simple rules, then layer alerts and escalations. Make the system do the watching—and only ping people when judgment is needed.
- Codify policies: Load
ReorderPoint,SafetyStock,Min/Max, andEOQby SKU/class; define default suppliers and lead times. - Turn on triggers: Enable auto‑create draft POs/TOs when
Available ≤ ROP; require approval for A‑items and high‑value buys. - Wire channel data: Integrate POS/e‑commerce so sales decrement available instantly and backorders flow to purchasing.
- Define exceptions: Negative on‑hand, late/short receipts, lead‑time variance, short‑dated lots (FEFO), oversells, and MOQ conflicts—each with owners and SLAs.
- Alert by priority: Route critical A‑item stockouts to real‑time alerts; batch C‑item notices into daily digests.
- Use checklists: Standardize “buy sheets” for buyers and “pick/receive fix” tasks for ops to resolve alerts fast.
- Add guardrails: Enforce pack multiples/MOQs, budget caps, and approval workflows; log reasons for overrides.
- Pilot and refine: Launch with a subset of SKUs; tune thresholds, alert noise, and approval levels before scaling.
Metrics and tools
Measure whether automation cuts firefighting and improves availability while reducing cost.
- Alert-to-action time:
Avg minutes from alert to PO/transfer creation. - Automated PO rate:
Auto‑generated POs / Total POs. - Expedite rate: Should drop as timely triggers reduce last‑minute buys.
- Stockout hours (A/B): Total hours SKUs are below zero/ROP.
- Exception backlog age:
Open exceptions with SLA breach / Total exceptions. - Service & inventory: Fill rate by class; DIO/turns trend.
Tools: a perpetual inventory/IMS or WMS with procurement automation, low‑stock alerts, and POS/e‑commerce connectors; barcode/QR scanning to keep counts accurate; rules for ROP/EOQ/min‑max; dashboards and webhook/email/mobile notifications. These automation‑first inventory management best practices free your team to focus on exceptions—not routine reorders.
14. Reduce slow-movers and deadstock with bundling, markdowns, and liquidation
Every dollar stuck in slow-movers is margin at risk. Turning aging stock into cash—before it expires, goes obsolete, or eats space—requires a playbook you can run on cadence. Bundling, planned markdowns, and liquidation are proven inventory management best practices to recover cash, free capacity, and lift sell-through.
What it is
A structured disposition strategy for SKUs with low velocity or zero sales over a defined age. Tactics include value-adding bundles/kits (NetSuite highlights bundling to move aging inventory), timed markdown ladders, and liquidation or return-to-vendor for last resort. The aim is to maximize recovery while protecting brand and keeping prime locations for winners.
How to implement it
Start with objective thresholds, then route items to the best recovery channel.
- Define aging triggers: Create age buckets (e.g., 30/60/90/120+ days no sale) by category; tighten for perishables/dated goods.
- Segment by recovery path:
- Aged-but-relevant → bundles/kits or cross-sell promos.
- Fashion/seasonal → markdown ladder (e.g., 20%/40%/60%).
- Obsolete/short-dated → liquidate, RTV, donate, or recycle.
- Bundle to add value: Pair slow-movers with A- or attach SKUs; offer BOGO, gift-with-purchase, or curated kits that solve a need.
- Schedule markdowns: Pre-plan price drops tied to age buckets; protect price integrity with channel-specific rules.
- Choose liquidation channels: Wholesale lots, outlet/clearance, secondary marketplaces, or vendor returns per terms.
- Protect brand and ops: Fence discounted offers (email list, outlet), quarantine liquidation inventory to avoid commingling.
- Close the loop: Feed learnings to forecasting, EOQ, and assortment decisions to prevent future deadstock.
Metrics and tools
Measure recovery, speed, and prevention.
- Sell-through rate (STR):
STR = Sales / Beginning-of-month stock × 100% - Stock-to-sales ratio:
BOM stock / Month’s sales - Aging exposure: Units and value in 60/90/120+ day buckets
- Recovery rate ($): Proceeds vs. cost on liquidated/markdown SKUs
- Weeks of cover (WOC):
On-hand / Avg weekly sales - Deadstock rate:
SKUs with 0 sales in X days / Total SKUs × 100%
Tools: POS/e‑commerce reports, perpetual inventory with age buckets, promotion/markdown rules in your IMS, barcode/lot tracking (for FEFO/expiry), and a simple disposition workflow to route items to bundle, markdown, or liquidation paths.
15. Streamline returns (RMA) and reverse logistics
Returns are inevitable; slow or sloppy reverse flows inflate write‑offs, tie up cash, and pollute inventory accuracy. A clear, scan‑first RMA process that quarantines, inspects, triages, and disposes product fast—while syncing with your perpetual system—turns returns from chaos into a controlled loop that protects availability and customer loyalty.
What it is
An end‑to‑end, standardized workflow for customer‑initiated returns: pre‑authorization (RMA number and label), receipt into a quarantine zone, barcode/lot/serial capture, condition/quality inspection, and disposition decisions (restock, rework/repair, repackage, return‑to‑vendor, liquidate/recycle). Reason codes feed forecasting and supplier/quality reviews, and credits are issued based on policy once inspection is complete.
How to implement it
Build the policy, dedicate space, and make every step system‑tracked so nothing slips.
- Publish clear policies: Return windows, eligibility, condition standards, and fees; map reason codes to every RMA.
- Pre‑authorize RMAs: Generate RMA numbers and labels via POS/e‑commerce; schedule receipts (B2B) to avoid dock surprises.
- Quarantine first: Create a marked MRB/quarantine area; no commingling with saleable stock before inspection.
- Scan on arrival: Capture
RMA#,SKU,LPN/Bin,Lot/Serial, and quantity; photo optional for condition disputes. - Inspect and triage: Decision tree to restock (like‑new), repackage, repair/refurbish, RTV per vendor terms, or liquidate/recycle/donate.
- Validate traceability: Reconfirm FEFO and lot/serial before any return‑to‑stock to preserve rotation and compliance.
- Credit quickly: Issue customer credits upon inspection per policy; separate consumer credit timing from RTV recovery.
- Automate tasks: Use RMA workflows with owner, SLA, and exception paths (short‑dated lots, hazmat, high‑value).
- Close the loop: Analyze reason codes and costs monthly; fix root causes (packaging, listings, sizing, carrier damage). Use offsite, climate‑controlled space if short‑term staging is needed.
Metrics and tools
Track speed, recovery, and accuracy so reverse logistics pays for itself.
- Return rate:
Return rate = Returns / Sales × 100%by SKU/channel - Time to disposition:
RMA receipt → final disposition - Time to credit:
RMA receipt → customer credit - Restock rate:
Restocked units / Total returned × 100 - Put‑back accuracy: Variance on restocked SKUs in next cycle count
- Reason‑code Pareto: Top drivers of returns and their share
- Cost per return: Handling + freight + write‑offs − recovery
- Recovery rate:
Proceeds from resell/liquidation / Cost of returns × 100 - Fraud/invalid rate: Ineligible returns detected vs. total
Tools: perpetual inventory/IMS with RMA module, POS/e‑commerce integration, barcode/QR scanning with lot/serial fields, FEFO allocation, quarantine/MRB zones, RTV terms in vendor records, and exception dashboards. Keep “no scan, no move” and “no move during inspection” as non‑negotiables to preserve accuracy.
16. Track the right inventory KPIs and review them on a set cadence
What you measure is what moves. A tight set of inventory KPIs—reviewed on a fixed rhythm—keeps service high, cash free, and firefighting low. Organize metrics into service, cost/cash, accuracy/controls, supplier reliability, and forecast quality so every meeting drives action, not arguments about numbers.
What it is
A small, standardized scorecard with clear owners, targets, and formulas that shows where you’re winning and where to fix process. Keep formulas transparent (posted right on the dashboard) and segment by ABC class and channel so decisions reflect item importance and demand patterns. Build daily, weekly, monthly, and quarterly reviews around the same scorecard to create momentum.
How to implement it
Start with a baseline and make it visible.
- Pick 8–12 KPIs: Balance service, cost, accuracy, supplier, and forecast metrics.
- Define the spec: Owner, target, calculation, data source, and drill‑down by SKU/class.
- Baseline 60–90 days: Capture history to set realistic targets.
- Build role‑based views: Floor (daily exceptions), ops (weekly trends), execs (monthly/quarterly).
- Lock the cadence: Daily standup, weekly ops review, monthly S&OP, quarterly supplier QBR.
- Tie to actions: Every miss gets an owner, root cause, and due date.
- Audit data health: Reconcile POS/e‑commerce, perpetual inventory, and supplier data monthly.
Metrics and tools
Track a balanced set with simple, shared formulas.
- Service
- Fill rate:
Shipped / Ordered × 100% - Stockout rate (A/B):
Stockout lines / Total lines × 100% - OTIF:
On‑time & in‑full / Total × 100%
- Fill rate:
- Cost & cash
- Inventory turnover:
COGS / AverageInventory - DIO:
365 / Turnover - Stock‑to‑sales ratio:
BOM stock / Month’s sales - Sell‑through (STR):
Sales / BOM × 100%
- Inventory turnover:
- Accuracy & control
- Inventory accuracy:
1 − |System−Physical| / Physical × 100% - Cycle count accuracy (%) and variance value
- Shrink rate:
Write‑offs / COGS × 100%
- Inventory accuracy:
- Supplier
- Lead‑time adherence:
|Actual−Promised| (days) - Supplier fill rate:
Received / Ordered × 100%
- Lead‑time adherence:
- Forecast
- MAPE:
(1/n) Σ |(A−F)/A| × 100% - Bias (%):
(Σ(F−A)/ΣA) × 100%
- MAPE:
Cadence guide:
- Daily: A/B stockouts, negative on‑hand, dock‑to‑book, late receipts.
- Weekly: Fill rate, pick accuracy, expedite rate, cycle count accuracy.
- Monthly (S&OP): Turnover, DIO, aging buckets, shrink, OTIF, MAPE/bias.
- Quarterly: Obsolescence, cash tied up, supplier scorecards, ABC refresh.
Tools: a perpetual inventory/IMS with POS/e‑commerce integration, barcode/QR scanning to protect data quality, exception dashboards, and scheduled reports. Keep formulas visible and decisions tied to owners so KPIs turn into improvements, not wallpaper.
Next steps
You don’t need all 16 moves at once—pick the 3–5 that solve today’s pain, set clear owners and targets, and review results on a fixed cadence. Expect quick wins in accuracy and service as receiving, rotation, and scanning tighten; cash follows as ROP/EOQ and S&OP stabilize buys and clear deadstock.
- Choose one planning lever (reorder points/safety stock + a monthly S&OP).
- Choose one execution lever (standardized receiving or barcode/QR scanning).
- Choose one space lever (slotting/pick paths or offsite overflow).
- Stand up a simple KPI dashboard and weekly ops review.
- Book a 30‑day checkpoint to tune thresholds and cadences.
Need immediate space relief while you implement? If you’re in Sioux City, rent climate‑controlled, keyless overflow with 24/7 access and ground‑floor convenience at Keyless Storage to protect goods, free prime pick lanes, and keep orders flowing.